I work on logging and analytics, and manage the underlying service that Supabase Logs and Logflare. The service do over a billion of requests each day with traffic constantly growing, and these devlog posts talk a bit about my day-to-day open source dev work.
It serves as some insight on what one can expect when working on high performance and high availability software, with real code snippets and PRs to boot. Enjoy!😊
This week, I'm hunting down a few things that are plaguing Logflare, namely:
- High memory usage over time
- Sporadic memory spikes and system slowdowns
For the first one, the root causes were quite straightforward:
There were a few culprits:
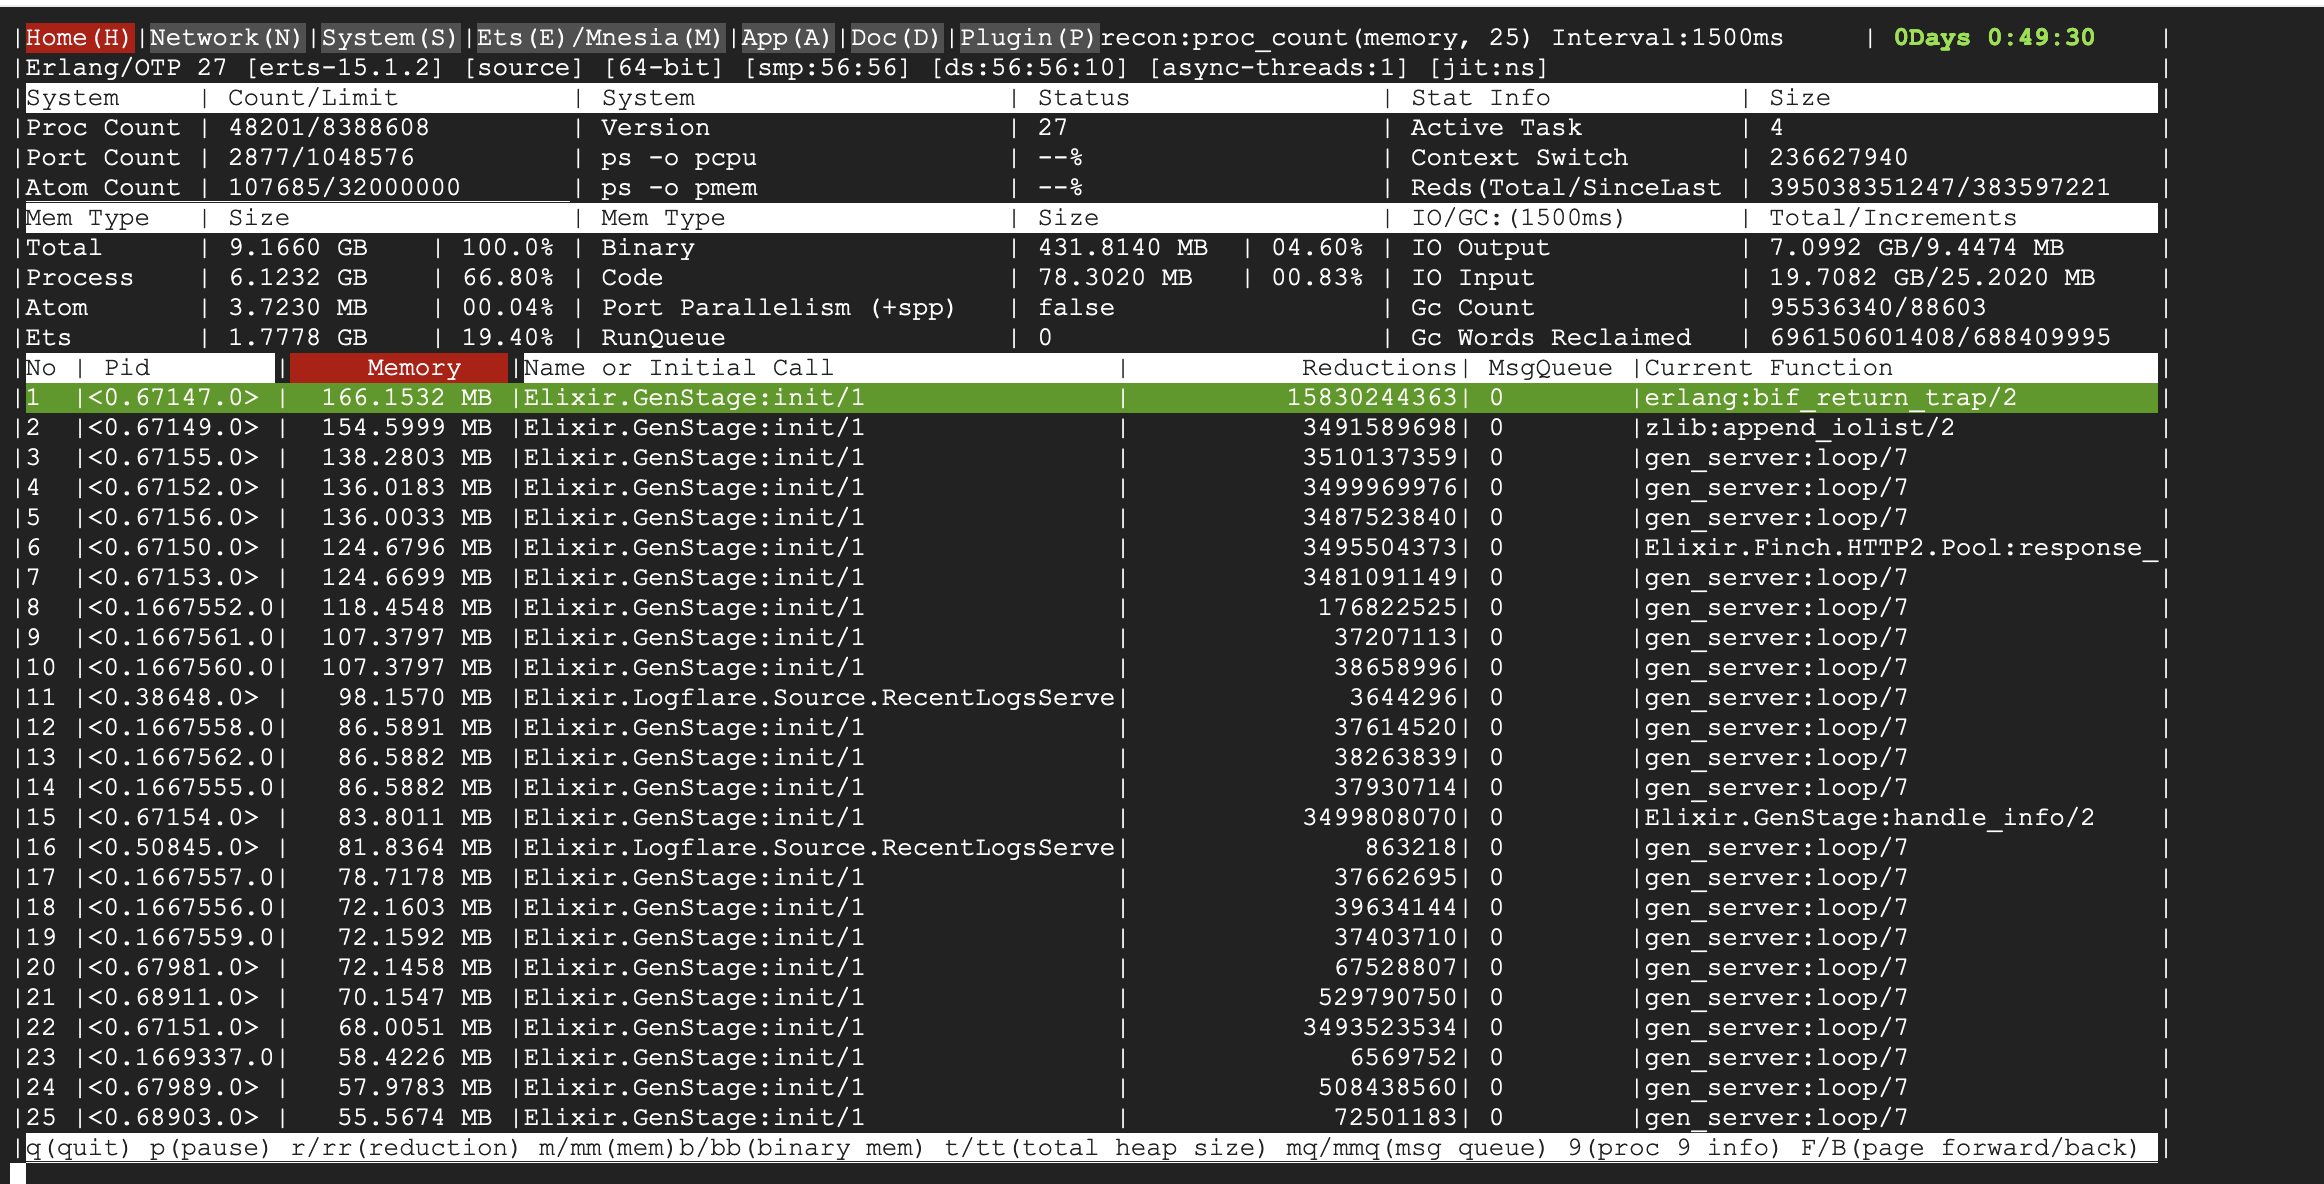
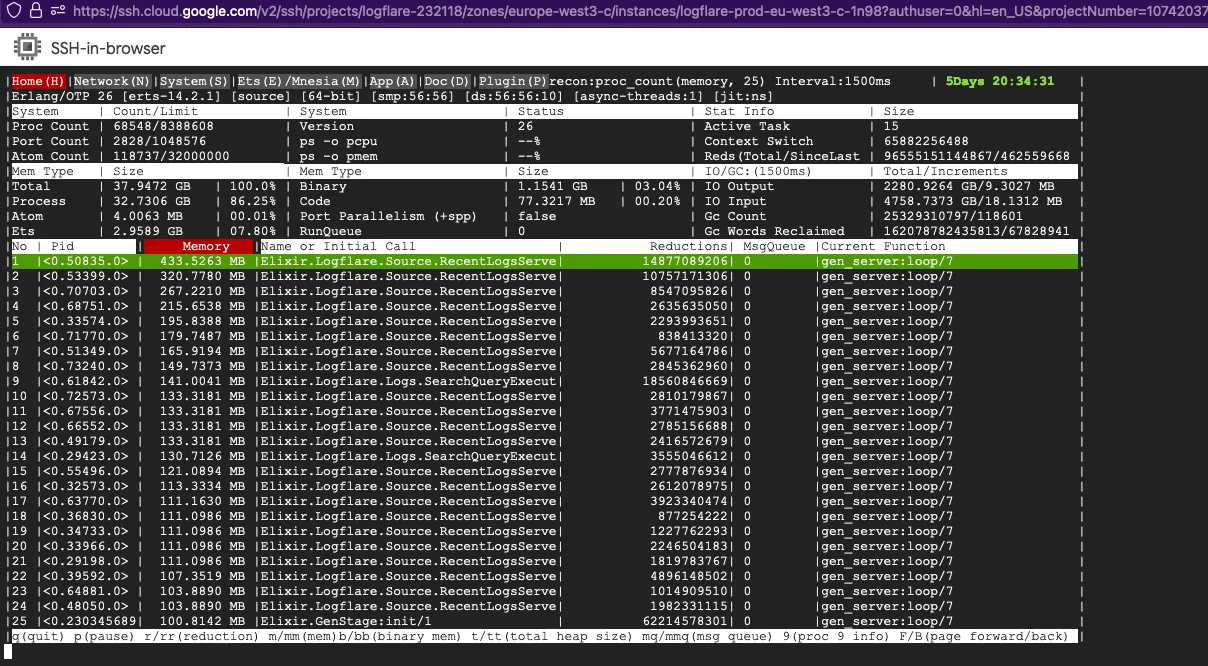
RecentLogsServer- This module is tasked with updating a counter for total events ingested in the table, periodically updating it. However, due to the small change in state, there were very few minor GCs triggered, resulting in a major GC never getting triggered.SearchQueryExecutor- This module is tasked with performing search queries as well as live tailing in the Logflare dashboard, and due to the amount of state that was kept and constantly updated, fullsweeps were not getting triggered, resulting in large buildups in garbage over time.
How the Erlang garbage collection works is really beyond the scope of this discussion, but a very detailed explanation is available in the official docs.
For the second issue, where the system would sporadically spike, the
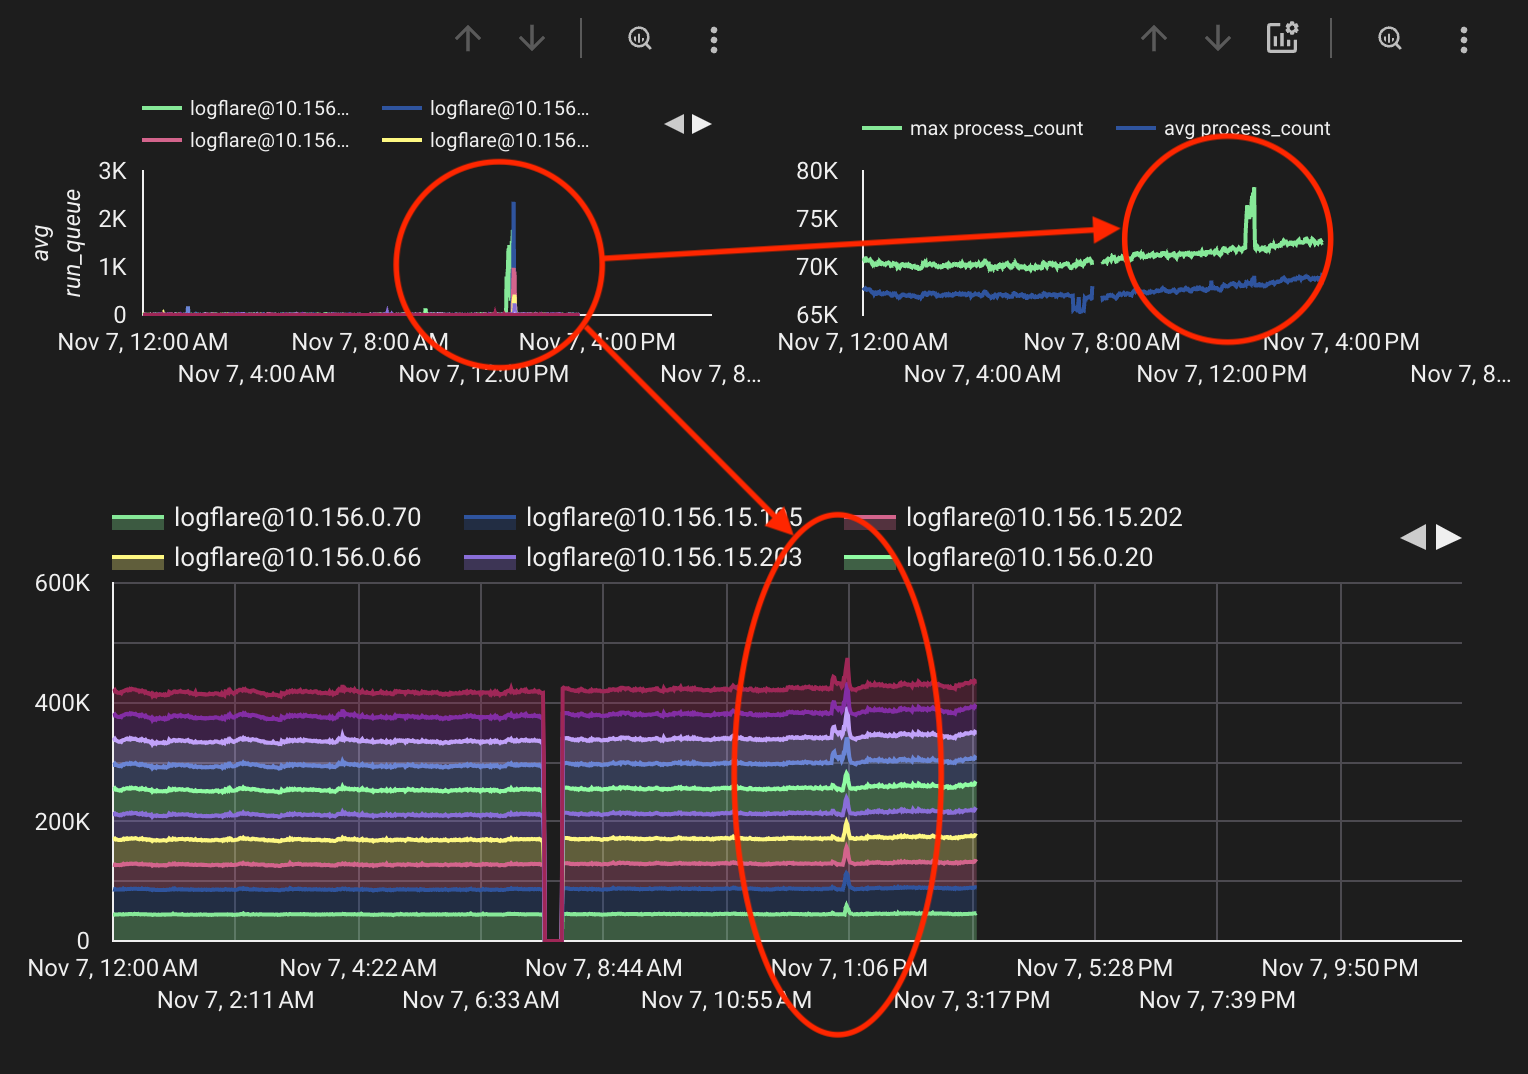
This run quue spike would cause the VM to "lock up", causing a few downstream effects:
- GenServer calls would start timing out and failing, as processes lock up and message queues build up, resulting in sudden spikes in memory.
- Incoming requests would be served slowly, resulting in a large slowdown and high latency. Incoming request payloads will also consume memory.
- Downstream API calls would get affected, as API calls would slow down, even non-ingest API calls.
However, run queue buildup is only just a symptom of the true problem, which required further diagnonsis and analysis.
Thankfully, we were able to narrow down the root cause of this run queue spike to the Cachex Courier.
The courier is responsible for handling much of the value retrieval of the main Cachex.fetch/4 function, and ensures deduplication of value retrival. However, it was possible that an error in the value retrieval would cause the process to lock up and stop responding to caller processes. This would then result in a flood of GenServer.call/3 failures, as calling processes would timeout.
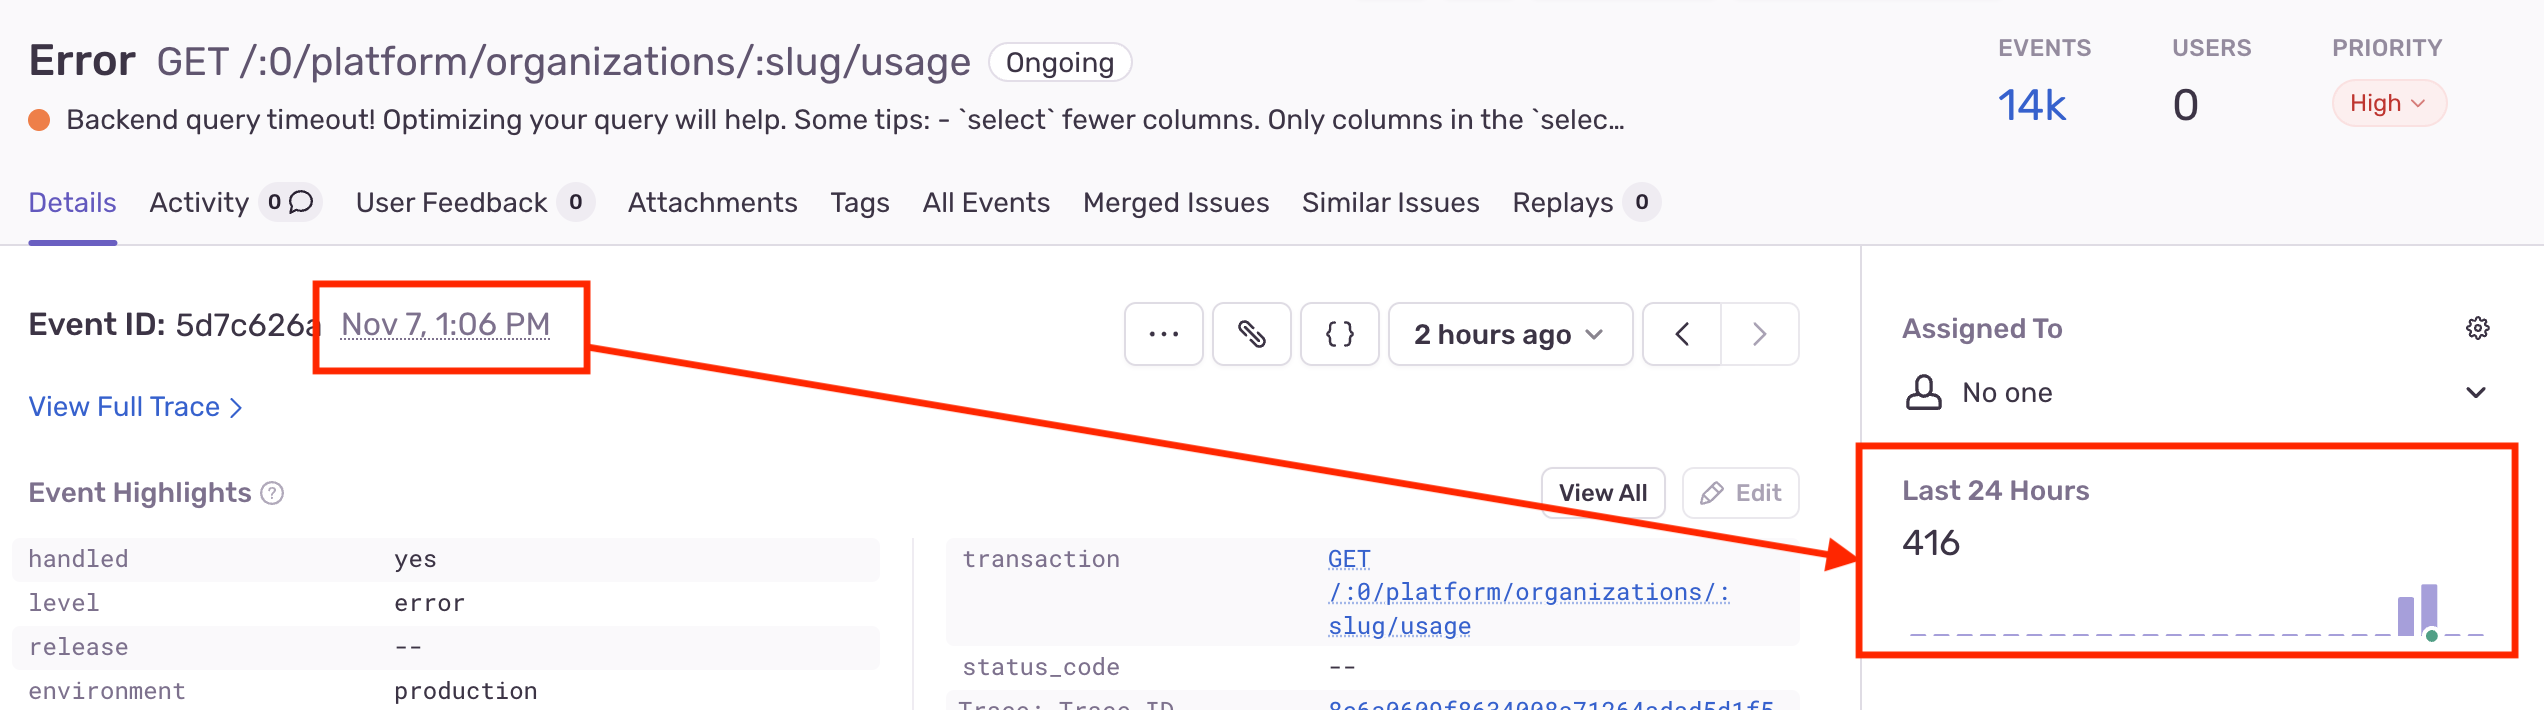
However, due to the throughput of request and data that Logflare handles (multiple billions of events a day), sudden large slowdowns in the ingestion pipeline would result in a snowball effect. This could be felt in more obvious downstream services, such as the Supabase dashboard, where certain heavily used API endpoints would fail sporadically.
It just so happened that this exact issue was patched in the latest Cachex v4.0.0 release, so upgrading to the latest version was sufficient.
The fix specifically involved adjusting the way that the value retrieval was performed such that it would spawn a linked process to perform the work instead of doing it within the process, while also ensuring that exits for the process were trapped. By trapping the exit, it could notify all callers that an error had occured and let the errors propagate upwards instead of blocking the caller until a timeout occurred.
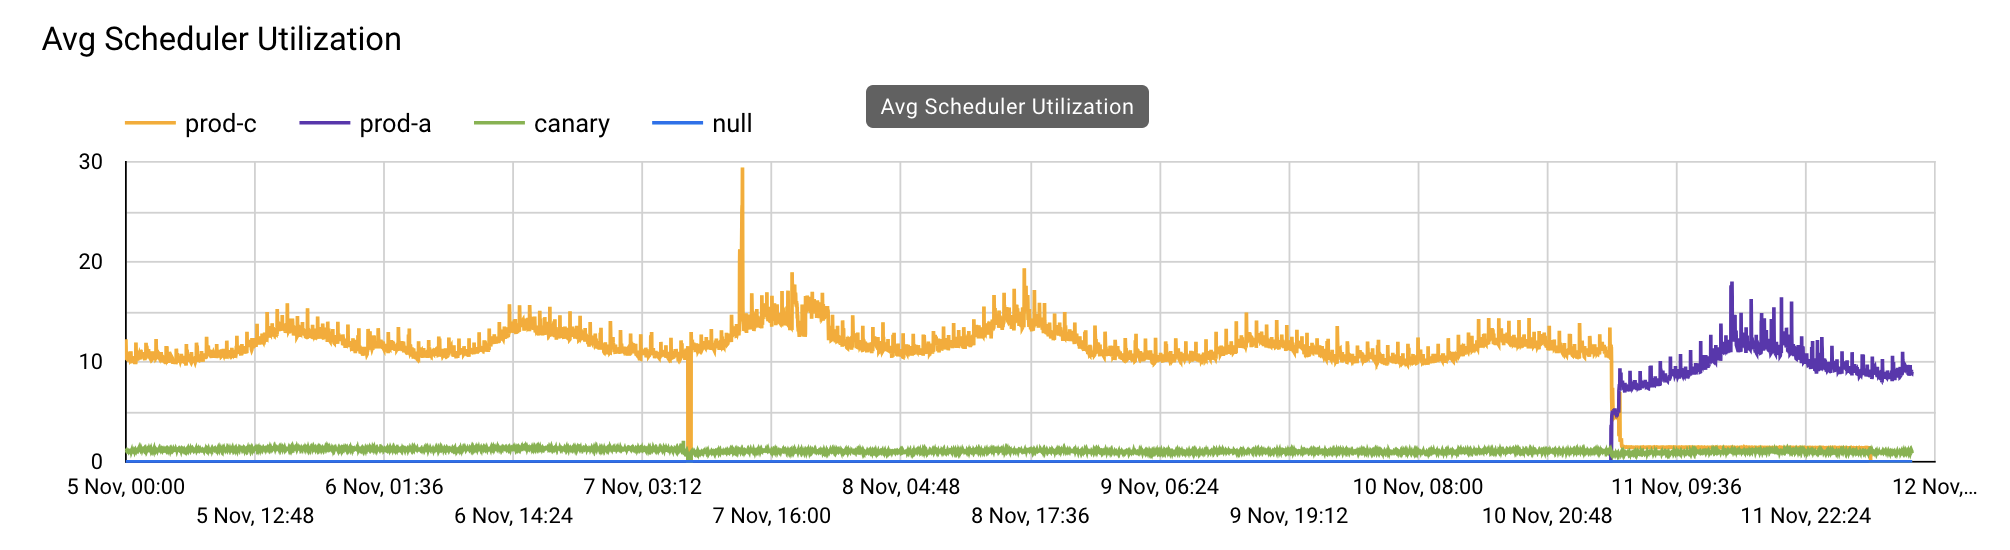
The final Logflare adjustments can be found in these changes, which resulted in a 3.5x memory reduction from and a 5-7% CPU improvement at production workloads.