13 posts tagged with "elixir"

View All Tags

ยท 3 min read
Ziinc
๐Ÿ‘‹ I'm a dev at Supabase

I work on logging and analytics, and manage the underlying service that Supabase Logs and Logflare. The service do over a billion of requests each day with traffic constantly growing, and these devlog posts talk a bit about my day-to-day open source dev work.

It serves as some insight on what one can expect when working on high performance and high availability software, with real code snippets and PRs to boot. Enjoy!๐Ÿ˜Š

This week, I'm hunting down a few things that are plaguing Logflare, namely:

  1. High memory usage over time
  2. Sporadic memory spikes and system slowdowns

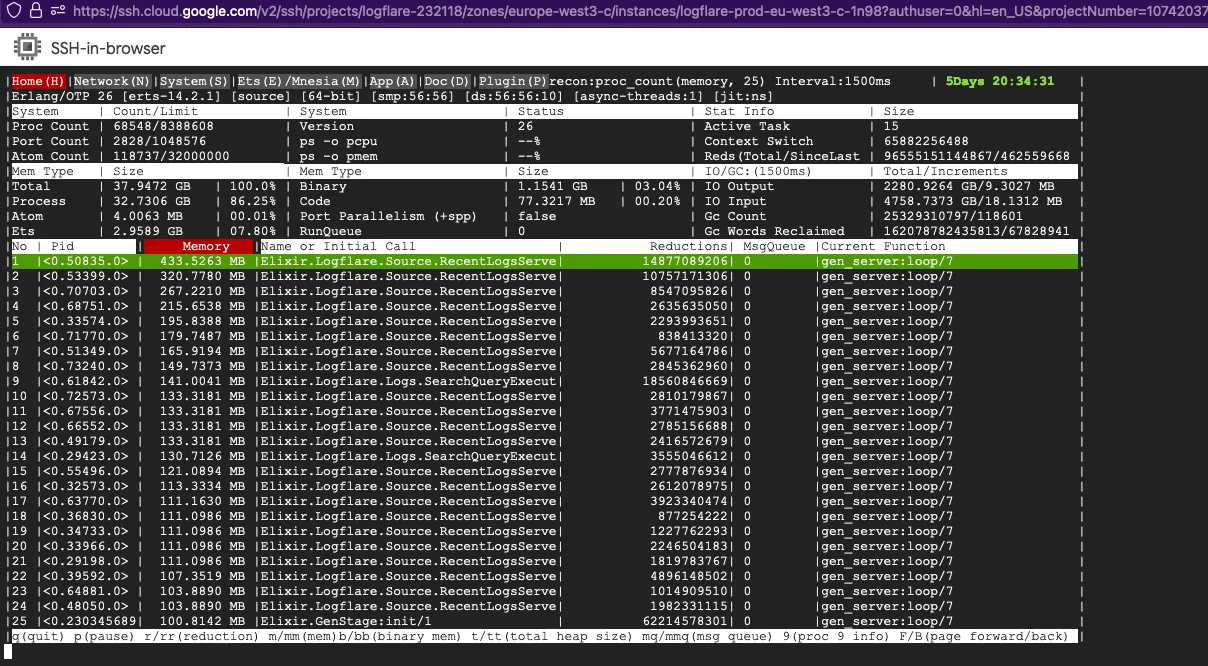
For the first one, the root causes were quite straightforward: High garbage collected

There were a few culprits:

  1. RecentLogsServer - This module is tasked with updating a counter for total events ingested in the table, periodically updating it. However, due to the small change in state, there were very few minor GCs triggered, resulting in a major GC never getting triggered.
  2. SearchQueryExecutor - This module is tasked with performing search queries as well as live tailing in the Logflare dashboard, and due to the amount of state that was kept and constantly updated, fullsweeps were not getting triggered, resulting in large buildups in garbage over time.

How the Erlang garbage collection works is really beyond the scope of this discussion, but a very detailed explanation is available in the official docs.

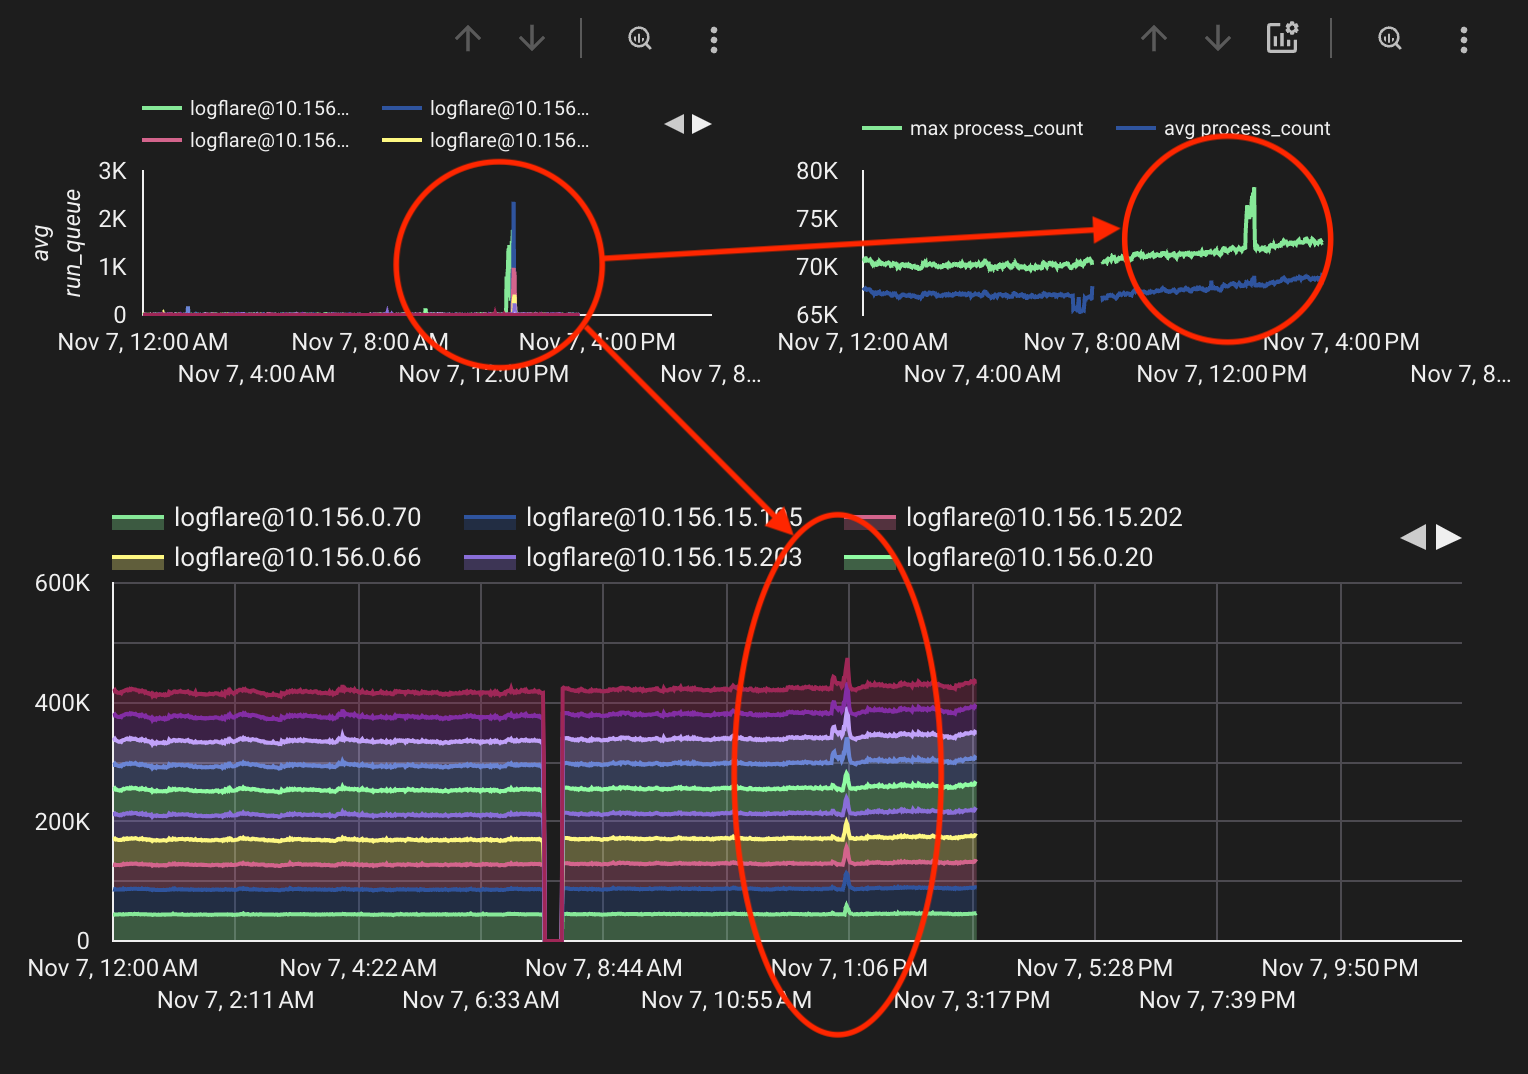
For the second issue, where the system would sporadically spike, the

This run quue spike would cause the VM to "lock up", causing a few downstream effects:

  1. GenServer calls would start timing out and failing, as processes lock up and message queues build up, resulting in sudden spikes in memory.
  2. Incoming requests would be served slowly, resulting in a large slowdown and high latency. Incoming request payloads will also consume memory.
  3. Downstream API calls would get affected, as API calls would slow down, even non-ingest API calls.

However, run queue buildup is only just a symptom of the true problem, which required further diagnonsis and analysis.

Thankfully, we were able to narrow down the root cause of this run queue spike to the Cachex Courier.

The courier is responsible for handling much of the value retrieval of the main Cachex.fetch/4 function, and ensures deduplication of value retrival. However, it was possible that an error in the value retrieval would cause the process to lock up and stop responding to caller processes. This would then result in a flood of GenServer.call/3 failures, as calling processes would timeout. However, due to the throughput of request and data that Logflare handles (multiple billions of events a day), sudden large slowdowns in the ingestion pipeline would result in a snowball effect. This could be felt in more obvious downstream services, such as the Supabase dashboard, where certain heavily used API endpoints would fail sporadically.

It just so happened that this exact issue was patched in the latest Cachex v4.0.0 release, so upgrading to the latest version was sufficient.

The fix specifically involved adjusting the way that the value retrieval was performed such that it would spawn a linked process to perform the work instead of doing it within the process, while also ensuring that exits for the process were trapped. By trapping the exit, it could notify all callers that an error had occured and let the errors propagate upwards instead of blocking the caller until a timeout occurred.

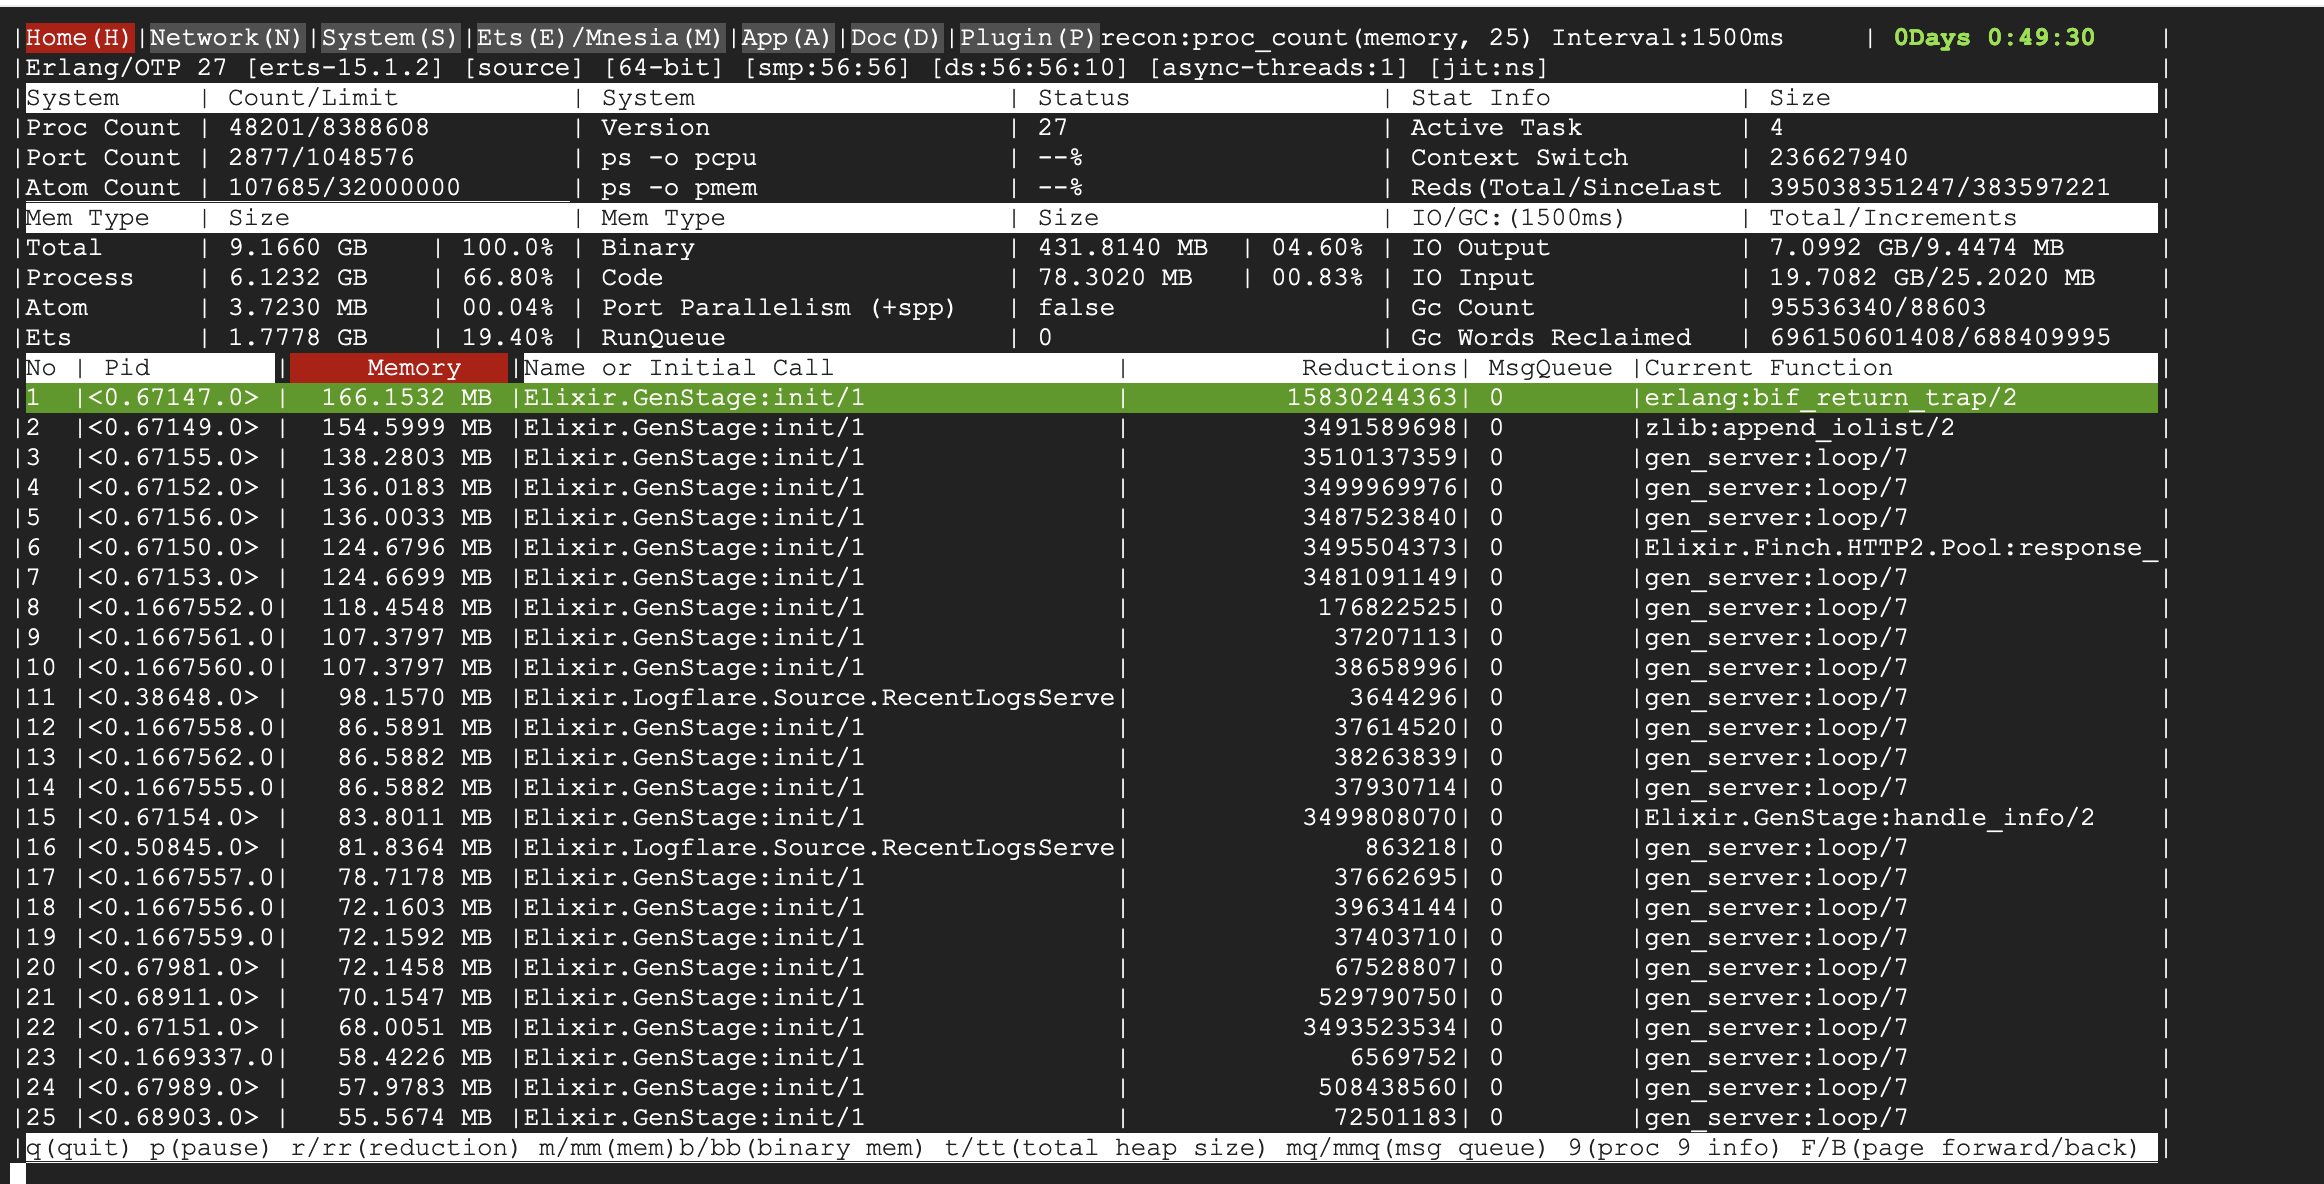
The final Logflare adjustments can be found in these changes, which resulted in a 3.5x memory reduction from and a 5-7% CPU improvement at production workloads.

Impact on memory after tweaking

Impact on scheduler utilization

ยท 2 min read
Ziinc

Quite surprisingly, Supervisors do not have an exposed option for taking a spawn_opt. spawn_opt are process options that are used to control the process behaviour when it comes to memory management, and can be incredibly useful when hunting down garbage build-up in processes.

The Backstoryโ€‹

This week in life at Supabase, we have some fun garbage collection optimization, and it mostly involves tweaking culprit process behaviours into clearing out their garbage in a timely manner.

Sometimes, garbage might build up as shown for a myriad of reasons, and we gotta take our massive major GC hammer to knock some sense into these processes that are stuck in a minor GC loop!

The Problemโ€‹

So, Supervisors don't actually take a spawn_opt, so after digging around, the only real option was to use the :erlang.process_flag/3 function, which is wrapped by Process.flag/2.

We can achieve the the :fullsweep_after tweaking as so:


def init(_arg) do
# trigger major GC after 5,000 minor GCs
Process.flag(:fullsweep_after, 5_000)
...
end

One would think that it would be accepted by Supervisor.start_link/2, but it seems like it isn't at all, and I had to dig into the Elixir source code to find that out.

A Word on Task.Supervisorโ€‹

Although the base Supervisor module doesn't accept the :spawn_opt option for its start_link/2 callback, the Task.Supervisor built-in module does accept it.

This can be see here where there is an explicit test case for this option passing.

Quite an interesting tidbit ๐Ÿ˜„

ยท 5 min read
Ziinc
๐Ÿ‘‹ I'm a dev at Supabase

I work on logging and analytics, and manage the underlying service that Supabase Logs and Logflare. The service do over a billion of requests each day with traffic constantly growing, and these devlog posts talk a bit about my day-to-day open source dev work.

It serves as some insight on what one can expect when working on high performance and high availability software, with real code snippets and PRs to boot. Enjoy!๐Ÿ˜Š

This week, I'm implementing OpenTelemetry, which generates traces of our HTTP requests to Logflare, the underlying analytics server of Supabase. For Elixir, we have the following dependencies that we need to add:

# mix.exs
[
...
{:opentelemetry, "~> 1.3"},
{:opentelemetry_api, "~> 1.2"},
{:opentelemetry_exporter, "~> 1.6"},
{:opentelemetry_phoenix, "~> 1.1"},
{:opentelemetry_cowboy, "~> 0.2"}
]

A quick explanation of each package:

  • :opentelemetry - the underlying core Erlang modules that implement the OpenTelemetry Spec
  • :opentelemetry_api - the Erlang/Elixir API for easy usage of starting custom traces
  • :opentelemetry_exporter - the functionality that hooks into the recorded traces and exports them to somewhere
  • :opentelemetry_phoenix - automatic tracing for the Phoenix framework
  • :opentelemetry_cowboy - automatic tracing for the cowboy webserver

Excluding ingestion and querying routesโ€‹

Logflare handles a ton of ingestion and querying routes every second, and if we were to track every single one of them, we would generate huge amount of traces. This would not be desirable or even useful, because storage costs for these would be quite high and a lot of it would be noise.

What we need is to exlcude off these specific API routes, but record the rest. We don't want to record all, of course, as usually a sample of a large amount of traffic would suffice in giving a good analysis of overall performance.

Of course, when using sampling, we would not have a wholly representative dataset of traces that would represent real-world performance. However, for practical purposes, we would be using the OpenTelemetry traces for optimizing a majority of request happy paths.

In order to do so, I had to implement a custom sampler for OpenTelemetry. The main pull request is here, and I'll break down some parts of the code for easy digestion.

Configuration Adjustmentsโ€‹

We need to make the configuration flexible enough to allow for self-hosting users to increase/decrease the default sampling probability. This also allows us to configure the sampling probability differently for different clusters, such as having higher sampling for our canary cluster.

# runtime.exs
if System.get_env("LOGFLARE_OTEL_ENDPOINT") do
config :logflare, opentelemetry_enabled?: true
config :opentelemetry,
traces_exporter: :otlp
traces_exporter: :otlp,
sampler:
{:parent_based,
%{
root:
{LogflareWeb.OpenTelemetrySampler,
%{
probability:
System.get_env("LOGFLARE_OPEN_TELEMETRY_SAMPLE_RATIO", "0.001")
|> String.to_float()
}}
}}
end

Lines in GitHub

We define a custom sampler that LogflareWeb.OpenTelemetrySampler works on the parent (as specified by :parent_based), and input the :probability option as a map key to the sampler.

We also conditionally start the OpenTelemetry setup code for the Cowboy and Phoenix plugins based on whether the OpenTelemetry exporting endpoint is provided:

# lib/logflare/application.ex
if Application.get_env(:logflare, :opentelemetry_enabled?) do
:opentelemetry_cowboy.setup()
OpentelemetryPhoenix.setup(adapter: :cowboy2)
end

Lines on GitHub

Remember that we set the :opentelemetry_enabled? flag in the runtime.exs above?

Custom Samplerโ€‹

The custom OpenTelemetry sampler works by wrapping the base sampler :otel_sampler_trace_id_ratio_based with our own module. The logic is in two main portions of the module: the setup/1 callback, and the should_sample/7 callback.

In the setup/1 callback, we ensure that we delegate to the :otel_sampler_trace_id_ratio_based.setup/1 with the probability float input. This would generate a map with two keys, the probability as is, and the something called :id_upper_bound.

# lib/logflare/open_telemetry_sampler.ex
@impl :otel_sampler
def setup(opts) do
:otel_sampler_trace_id_ratio_based.setup(opts.probability)
end

How the trace ID sampling works is that each trace has a generated ID, which is a super large integer like 75141356756228984281078696925651880580. A bitwise AND is performed using a hardcoded max trace ID value, and the result of the bitwise AND is then used to compare against the upper bound ID. If it is smaller than the upper bound ID, then it will record the sample, otherwise it will drop it. This is implementation specific and is out of scope for this blog post, but you can read more about the OpenTelemetry spec on the TraceIdRatioBased sampler specification.

Here is the code. For brevity sake, I have omitted the arguments for should_sample/7 the function call and definition:

# lib/logflare/open_telemetry_sampler.ex
@impl :otel_sampler
def should_sample(... ) do
tracestate = Tracer.current_span_ctx(ctx) |> OpenTelemetry.Span.tracestate()

exclude_route? =
case Map.get(attributes, "http.target") do
"/logs" <> _ -> true
"/api/logs" <> _ -> true
"/api/events" <> _ -> true
"/endpoints/query" <> _ -> true
"/api/endpoints/query" <> _ -> true
_ -> false
end

if exclude_route? do
{:drop, [], tracestate}
else
:otel_sampler_trace_id_ratio_based.should_sample(...)
end

Lines on GitHub

Here, because this will be a highly executed code path, we use a case for the path check instead of multiple if-do or a cond-do, because binary pattern matching in Elixir is very performant. Furthermore, binary pattern matching is perfect for our situation because we only need to check for the first part of the HTTP route that is called, instead of all.

The code is relatively simple, it delegates to :otel_sampler_trace_id_ratio_based.should_sample/7 if it is not in one of the bad path. If it is one of the hot paths, we will drop the trace. As this sampler works on the parent, it will drop all child traces as well.

Arguably, we could optimize this even further by re-writing the conditional delegation into mutliple function heads and pattern matching on the attribute argument and doing the binary check within the function guard. As always, premature optimization is the enemy of all software engineers, so I'll defer this refactor until the next time when I need to improve this module.

Wrap upโ€‹

And that is how you implement a custom OpenTelemetry sampler!

ยท 3 min read
Ziinc

It has been a long time since my initial post on using Distillery to manage Ecto migrations on startup, and I'm super happy that the Elixir core team has worked on making deployments a breeze now.

The absolute simplest way to achieve migrations on startup is now as follows:

  1. Write the migrator function using this example here
  2. Add a startup script in the release overlays folder
  3. Add the startup script to your dockerfile CMD

Writing the Migrator Functionโ€‹

This is going to be largely lifted from the Phoenix documentation, but the core aspects that you need are all here:

defmodule MyApp.Release do
@app :my_app

def migrate do
load_app()

for repo <- repos() do
{:ok, _, _} = Ecto.Migrator.with_repo(repo, &Ecto.Migrator.run(&1, :up, all: true))
end
end

defp repos do
Application.fetch_env!(@app, :ecto_repos)
end

defp load_app do
Application.load(@app)
end
end

I have left out the rollback/2 function, but you can include it in if you really think that you will need it. Its more likely that in reality you'll just add in a new migration to fix a bad migration, so it is up to personal preference.

Adding the Startup Scriptโ€‹

With Elixir releases, we now have a nice convenient way to copy our files into our releases automatically, without having to do multiple COPY commands in our dockerfiles. Neat! Anything to save a few lines of code!

Create your startup file here:

# rel/overlays/startup.sh
./my_app eval "MyApp.Release.migrate"
# optionally, start the app
./my_app start

This assumes that we will be setting our working directory to our release root, which we will do in our docker file. If you wish to couple the migrations together with the app startup, you can add the optional ./my_app start portion. However, you can also decouple it so that you don't end up in a bootloop in the event of a bad migration. As always, it really depends on your sitation.

And then in your release configuration:

# mix.exs
releases: [
my_app: [
include_executables_for: [:unix],
# the important part!
overlays: ["rel/overlays"],
applications: [my_app: :permanent]
]
]

This will then copy your files under the re/overlays directory over to the built release.

Add the Startup Script to Dockerfileโ€‹

Let's run the startup script now from our dockerfile as so:

WORKDIR ".../my_app/bin"
CMD ["./startup.sh"]

The three dots are for illustration purposes, adjust the WORKDIR to the actual directory that you copied your release binaries to. If you coupled your app startup together with the startup script, the above CMD will run the migrations and then start up the app.

If you wish to decouple the migrations from the startup, you can do the following:

WORKDIR "..."
CMD ["./startup.sh", "&&", "./my_app", "start" ]

Wrap Upโ€‹

An important mention is that Phoenix now comes with mix phx.gen.release which also comes with a dockerfile option for bootstrapping docker-based release workflows. The migration files are also automatically generated for you too. However, you wouldn't want to use the helper if you aren't doing any Phoenix stuff, and the above example walkthrough will work for any generic Elixir release.

Thanks for reading!

ยท One min read
Ziinc

You can run multiple ExUnit test lines with the following:

mix test my_app/test/path_to_file_test.exs:123:223:333

Each number prefixed with the colon will be run. The above example results in 3 lines being run, with the following result:


Running tests...
==> my_app
Excluding tags: [:test]
Including tags: [line: "123", line: "223", line: "333"]